Analytics
Analyze BIM component installation progress: productivity metrics, trend charts, and per-group breakdowns.
Using Analytics
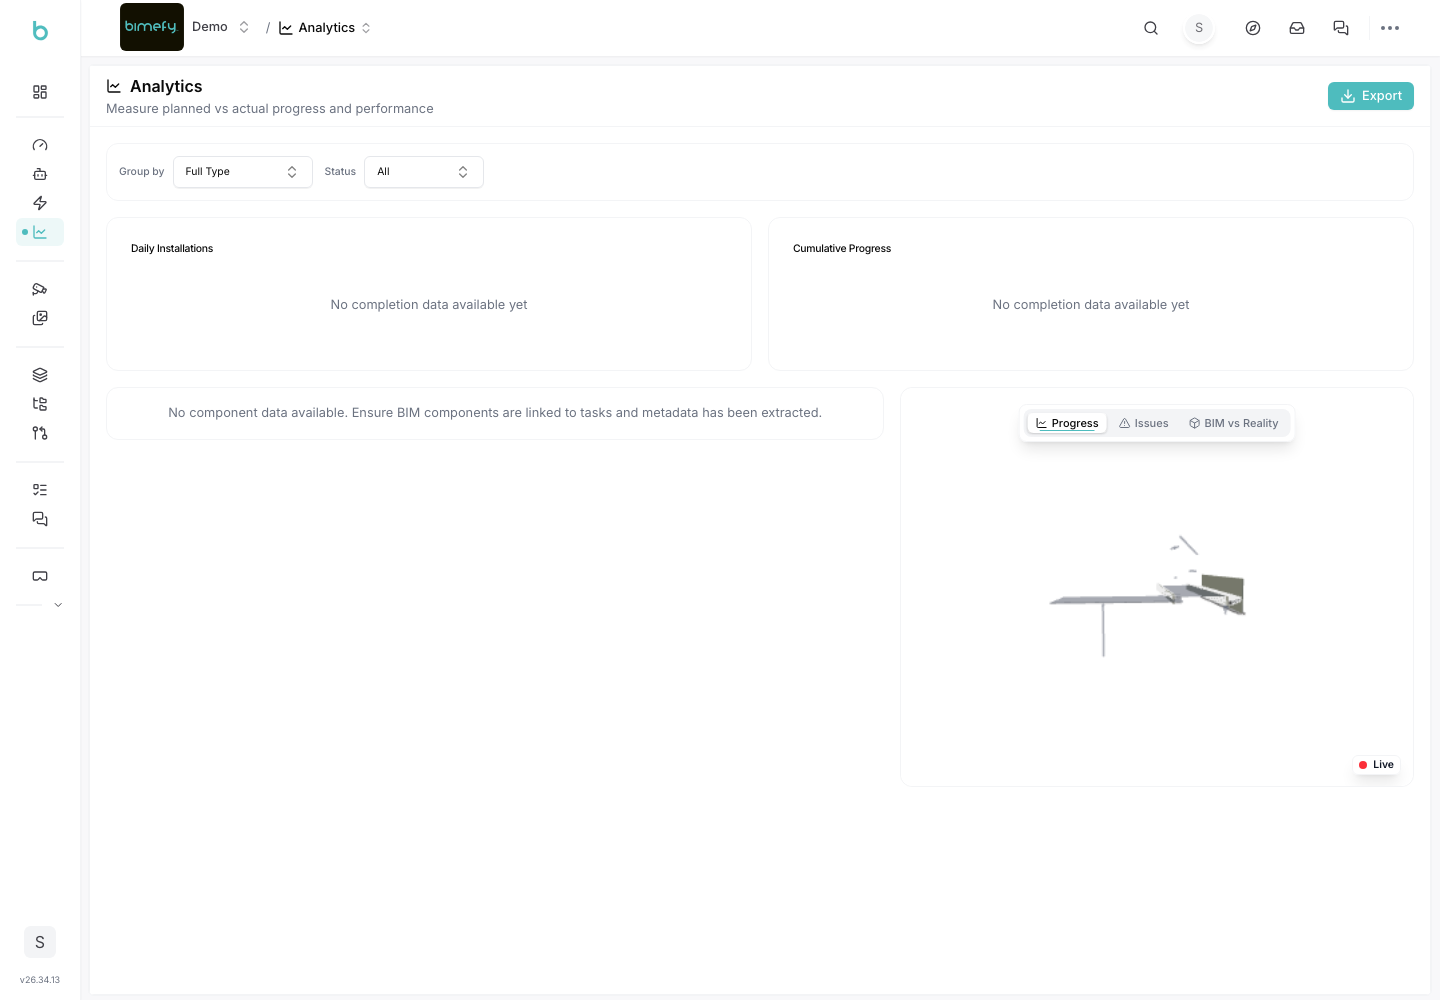
Analytics (currently in beta) analyzes your BIM components' installation/completion data, grouped however you like, to surface productivity trends and outliers. It's found under Site Intelligence in the left-side menu, alongside the Site Dashboard, the AI Agent, and Automations.
1. Accessing Analytics
1. Navigate to Analytics:
- In the left-side menu, under Site Intelligence, click Analytics.
2. Grouping and Filtering
- Group By: bucket components by Full Type, IFC Class, Family, Type, or Level.
- Status Filter: narrow to All, Done, or In Progress components.
3. Productivity Metrics
- A metrics strip shows: Average installed per day, Best Day, Total Installed vs. total components, Predicted Completion date, and a week-over-week Trend percentage.
4. Charts
- Daily Installations: a bar chart of daily completions with a 7-day rolling average line.
- Cumulative Progress: actual cumulative installation as an area chart, plus a dashed linear projection toward completion (capped at 90 days out).
5. Insights Panel
- Surfaces the slowest groups, the group with the most variance, and the overall installation rate per day.
6. Group Table
- A sortable, paginated table with columns for Group, count, a progress bar, average duration, per-day rate, variance vs. project average, and a Confidence badge (high/medium/low).
- Click a row to expand a Duration Distribution histogram and a per-component table that flags outliers, plus an embedded BIM viewer widget that highlights the selected group's elements color-coded by status.
7. Exporting
- Use the Export dropdown to download the currently filtered groups (and per-component detail) as CSV or JSON.